
The Year of Samson
Rajasthan Royals have been steadily improving & no one represents their growth better than Sanju Samson. Having started IPL 2023 with 55 (32) to dismantle SRH, Samson’s recent IPL numbers are worth a closer look.
The 50 in the Royals’ opening game of IPL 2023 was Samson’s 9th 50+ IPL score since 2020 – that’s once every 5.1 inns. Pretty solid, but it’s his aggressive style that catches the eye. Samson grabbed 10 off his first 5 balls against SRH & raced to his 50 in 28.
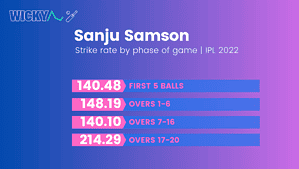
Those brisk starts are typical Samson. Last season, his strike rate in his first 5 balls was a healthy 140. Most impressive, though, was his consistent rate of scoring. Samson started at 140 in his first 5 & struck at 148 in the first 6 & 140 in the middle phase.
That’s a fall, but not a huge one & certainly not the biggest in the IPL. Samson hits pretty indiscriminately – he’s a bigger threat with the field up but hardly a crawler when it spreads.
A strike rate of 214 at the death looks even better but that figure comes from just 21 balls compared to 207 in the middle overs. Overall, Samson struck at 146 last year.
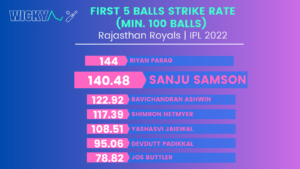
Relative to his teammates, though, that healthy SR of 140 in his first 5 balls looks positively Jessopian. Among the Royals’ main sticks in 2022, Samson was the 2nd best behind Riyan Parag. It’s a long way down to Ravichandran Ashwin in 3rd.
This was a team of slow starters but Samson was at the races straight away. Just look Jos Buttler’s mark – he finished with an eye-popping 863 runs last year, 1.88x Samson’s total & he’s rock bottom of this group.
Want more IPL analysis? Check out some cool numbers on Axar Patel, Liam Livingstone, Tim David, and the RCB batters!
The rise and rise of Sanju Samson
Royals lost the final to Gujarat last year, but it was a hugely successful campaign considering the wretched few seasons before that. Improvement is their defining feature. They’ve started IPL 2023 well, have a good squad & seem to be heading in the right direction.
Samson symbolises the progress of the whole unit better than anyone. He has 3 400-run seasons in the last 5 campaigns, with two in the last two years. Overall since 2019, Samson has been on an upward trajectory for runs in the IPL.
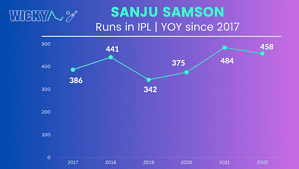
Even his worst season in this time yielded 342 runs. It’s all especially impressive considering that from 2017-21, Samson’s avg league position in an 8-team league was 6.4. Last season was the first time personal success coincided with team success.
Samson’s struggled with consistency before but has improved a lot lately. He’s still outside the very elite but now has two straight top 10 finishes in the Orange Cap standings – 6th (2021) & 9th (2022). His average position in the 4 years before that was 16.75.
At 28, Samson’s entering his prime. He got a few chances for India in 2022 but with the white ball teams recently hit with a spate of injuries, a strong IPL could really push his case for regular international selection.
It would perfectly cap two seasons of progress.
Check out our IPL T20 Match Simulator to see how your favourite stars perform over 100 simulations!
Rohit Sharma’s left arm pace woes
The Indian captain’s struggles v left arm seam are well known. In a poor IPL 2022, they stood out even more.
Rohit faced a fair bit of left arm pace last year – almost as much as all spin types combined. It’s still well short of his balls faced v right arm pace – roughly 1/3 of that figure. But it was his 2nd most common bowling type faced in 2022.
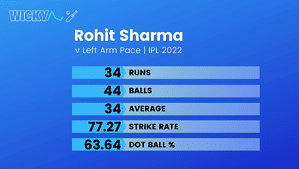
That comfortably sub-100 strike rate against left arm quicks stands out. Versus right arm pace last year, Rohit struck at 135 – that’s 1.75x his mark against the left arm stuff.
Rohit’s dot ball % v left arm seam last season was a whopping 63.64% compared to 50.36% against right arm pace. But pair that with his average of 34 & the full picture of Rohit against left arm pace last year becomes visible.
Only 1 of Rohit’s 14 dismissals in IPL 2022 was by left arm seam – Mukesh Choudhary v Chennai, for his only duck of the season. 8 were to right arm pace, 2 to off spin & 1 each to left arm ortho, leg spin & left arm wrist spin.
If the recent past is any guide, Rohit doesn’t get out to left arm pace that much but he REALLY struggles to score. The game v Delhi at Wankhede last year is a perfect example – Khaleel Ahmed opened with 8 straight dots to Rohit in 8 legal balls.
Wondering how our T20 Match Simulator works? We’ve got you covered with this article
Bhuvneshwar Kumar can still go at the death
In IPL 2022, Bhuvneshwar Kumar was solid if unspectacular for a tepid SRH – 12 wkts at 31, econ 7.34, 27th in the Purple Cap standings.
His role is well defined – 2 up top, 2 at the end – & he really stood out in the latter phase.
Not to say that Bhuvi didn’t offer control up front last year – a hair over half his deliveries in the first six gave no runs & his economy was under 7.
That’s pretty good, but relative to his peers it’s middling rather than outstanding.
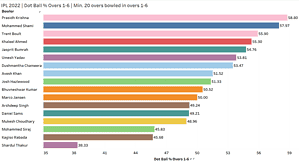
Among the most regular powerplay bowlers in IPL 2022, those who bowled at least 120 balls in the first six, Bhuvi ranks 10th out of 17 for dot ball %.
Want more IPL analysis? Check out our breakdown of how Mohammed Shami’s role has changed at Gujarat Titans & much more
Control up front
When it came to building pressure, there were six other Indians ahead of him.
These half dozen names include the extraordinary Jasprit Bumrah, IPL 2022 winner Mohammed Shami, beaten finalist Prasidh Krishna, and a resurgent Umesh Yadav.
This little snapshot suggests the most experienced Indian bowlers, Bhuvi included, are still the IPL’s most regular powerplay bowlers & the group best at building pressure up front.
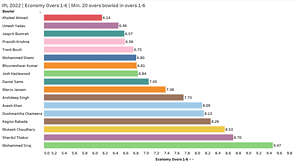
Last year, Bhuvi was better at keeping the runs down in the first six than bowling dot balls. But it wasn’t by that much.
In this group of 17, he ranks 7th for economy rate. Any mark under 7 is very good – but all the aforementioned names are ahead of Bhuvi here too.
Bhuvi, however, offered much more relative control at the death last season.
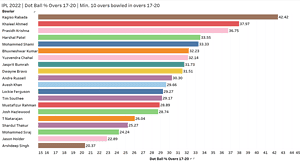
Of the 20 bowlers who bowled at least 10 overs in overs 17-20 last season, he ranks an impressive 6th for dot ball % – just under 1/3 of his deliveries at the back end.
Stifling the score at the back end
Truthfully, when it came to building pressure with dot balls at the death last season, there was Kagiso Rabada and there were all others.
But Bhuvi ranked above even Bumrah here & was one of 10 bowlers to clear the 30% mark.
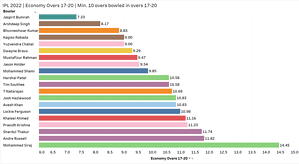
Sort this group by economy rate and Bhuvi looks even better – python-like in his suffocation of the scoring.
Only Bumrah and Arshdeep Singh had a better mark than his 8.83 in the death overs.
Bowling at the death is tough and many struggled – Harshal Patel, Avesh Khan, Khaleel Ahmed & T Natarajan – so impressive in other phases – all posted double-digit economies at the back end last season.
So far in IPL 2023, Bhuvi isn’t stifling the scoring as well as he did last season in either phase. However, his dot ball % figures in both the first six and the final four are currently ahead of his numbers last season.
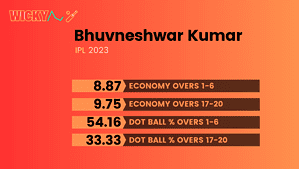
But it’s worth pointing out that although Bhuvi is still nailed on for two overs up front – 8 powerplay overs in 4 games so far – he’s not bowled that much at the death this year.
Those death overs figures come from just 4 overs – an avg of 1 over per game.
The recent past suggests Bhuvi can still go at the death – his death overs economy hasn’t suffered as much as his powerplay mark in IPL 2023, although info is still limited.
Visit our friends at flashscore.com.au for live cricket scores from all major T20 leagues including the Indian Premier League, Big Bash League, T20 Blast, Pakistan Super League, NZ Super Smash, SA20, and more!
Sunil Narine’s struggles against Sunrisers
Sunil Narine only took 9 wkts in IPL 2022. That put him a distant 35th in the Purple Cap standings for most poles.
But his economy was frankly absurd – 5.57, with a dot ball % of 40.89. Hyderabad were the only side last year to seriously shake off Narine and his vice-like grip.
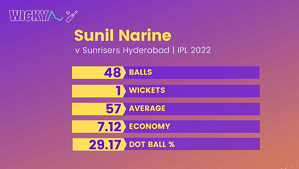
Narine averaged 57 v SRH last year – easily his worst against any opponent. Across two games v Hyderabad in 2022, he only took the wicket of Nicholas Pooran at Pune. But the really interesting figure is that dot ball % of 29.17.
Overall, Narine bowled 40.89% of his 56 overs last year for no runs – the best for any spinner with min 30 overs bowled. Remarkably, he was even a tick ahead of the considerably more prolific Wanindu Hasaranga (40.06%) – 26 wkts last season to Narine’s 9.
In fact, lower that filter to min 20 overs bowled & Narine is still behind only Glenn Maxwell (24 overs, less than 1/2 of Narine) for dot ball % among slow bowlers. All told, that mark of 29% v SRH was very low by Narine’s own standards last season.
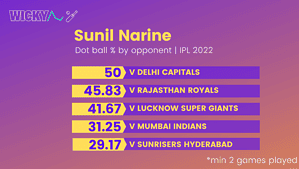
It was also his worst return v any opponent against whom he played more than once in 2022. Only Gujarat threw Narine off his game to a comparable degree as SRH – dot ball % also 29.17; 7.75 econ; but that was from one match, not two.
Where it went wrong
Narine, who was all about control last season, was uncharacteristically knocked about & hit for boundaries by SRH. His economy of 7.12 in two games v Hyderabad looks distinctly average by his own standards. So what happened?
Well, Abhishek Sharma & Rahul Tripathi got after him early on. At Brabourne Stadium, Tripathi hit him for six in his second over & rotated strike effectively with Aiden Markram. Narine returned 0/14 from his first 2 overs.
At Pune, Abhishek hit Narine back over his head for four first ball. He then blasted him for consecutive sixes in his second over. Again, Narine returned 0/27 from his first 2 overs.
In fact, in these two SRH games, Narine returned 4-0-41-0 in his first two overs. In his last two overs, the figures were 4-0-16-1. There are runs to be had against him early on.
Header image: Rajasthan Royals/CC BY 3.0/via Wikimedia Commons/https://creativecommons.org/licenses/by-sa/4.0/legalcode
If you want to follow more of our IPL analysis or any of our other work at Wicky, please reach out via email or on social media.